
How to Use TrainingPeaks?
1. How to Use TrainingPeaks
2. “Summary” window
3. “Analyze” window
4. Workout analyze
Hello, it is Coach Damian
Today I want to show you how to use TrainingPeaks so you can build your workouts and learn how to analyze them.
Let’s start it!

1. How to Use TrainingPeaks
TrainingPeaks is the best coaching tool as well as a great tool for every athlete.
You can track your fitness level, progress in your training plan and even predict future fatigue and form.
1.1 TrainingPeaks login
Where should you start?
Here you can create your account and here you can log in, this is a first step to be able to use TrainingPeaks.
The next step is to upload your previous workouts and connect your Garmin, Wahoo account so your workout can be uploaded automatically.
Feel free to connect to our coaching account to get free training analysis.
In the next steps you can find overview of TrainingPeaks platform and learn how to analyze your workouts.
2. Summary Window
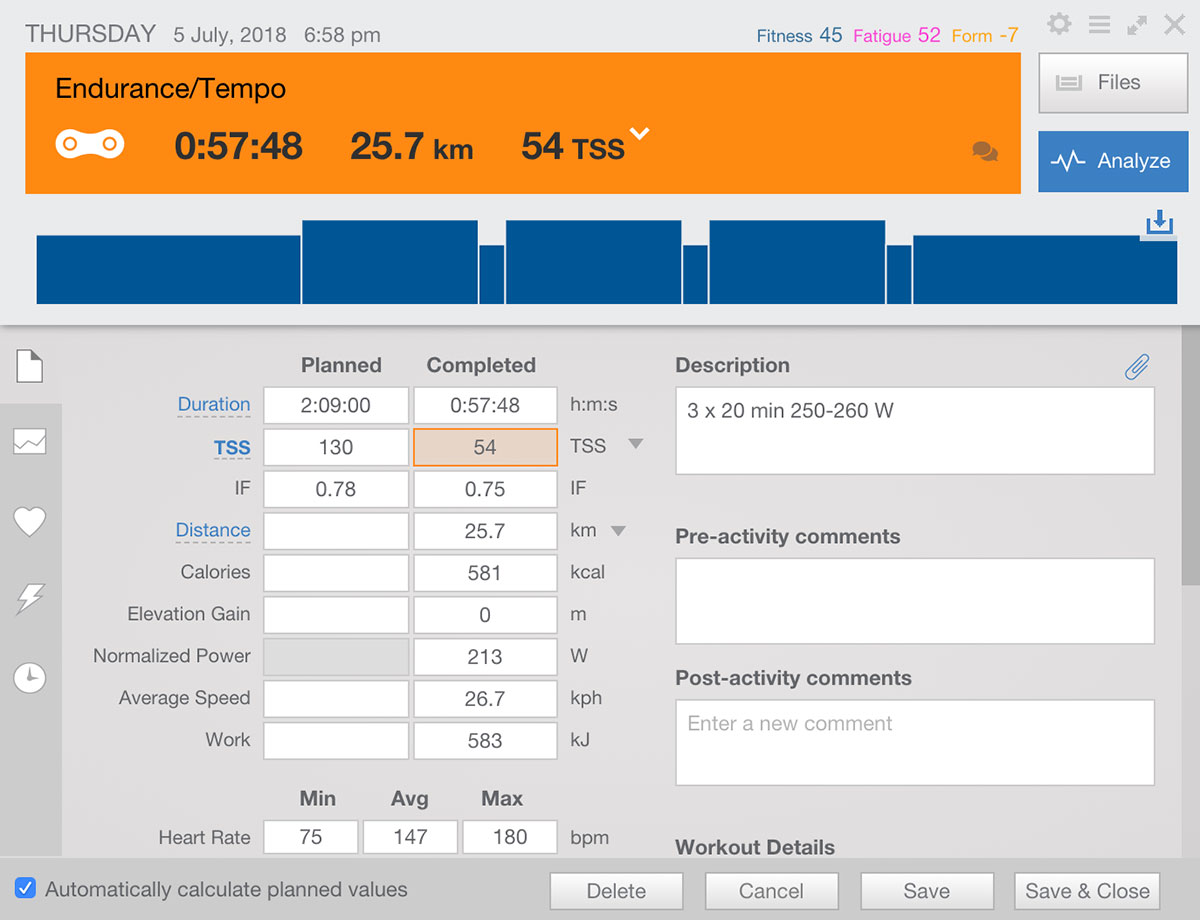
2.1 Overview
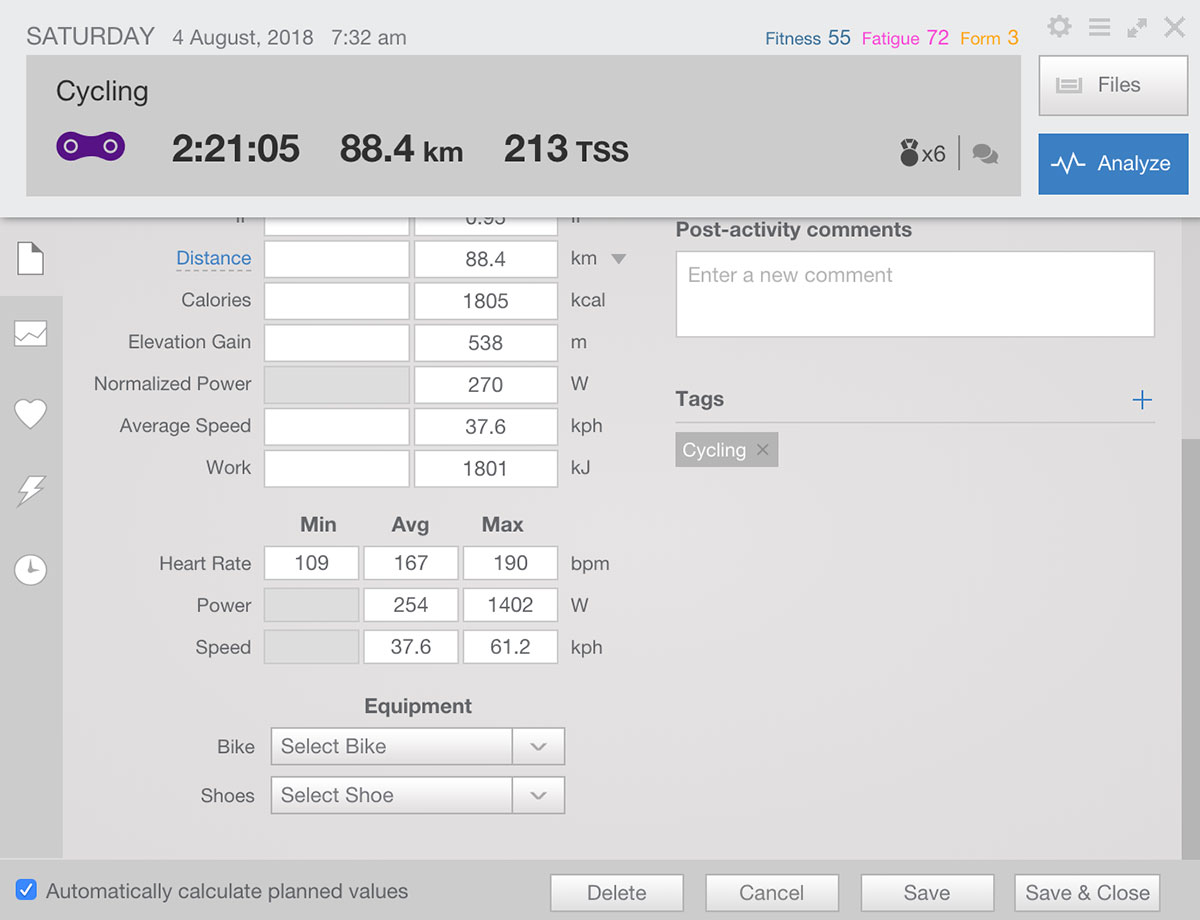
The summary window in TrainingPeaks is the first thing you see after clicking on workout file in TrainingPeaks. In the first row, you can see most basic information about a workout like: time, distance, number of TSS (Training Stress Score) than medal and comments. Going down we can see all our Peak Performances from the workout.
Below we have two columns “Planned” and “Completed”.
“Planed” part is for you to fill out before workout it is your overall plan for the day, how many hours you want to ride, how many kilometers you want to do or how many TSS.
“Completed” part will be filled out automatically after uploading a file from your workout. At this part, we can all common information about your workout.
– duration
– TSS (Training Stress Score)
– IF (Intensity Factory) we will get there
– distance
– calories
– elevation gain
– Normalized Power (NP)
– average Speed
– work (kJ)
The right-hand part of window id for al “text data” like description, pre-activity comments and post-activity comments. Training Peaks is a great communication tool which allows you to put a lot of information about how to do you the workout of how did you fill this day before and after a workout. I strongly recommend to use those fields, it is a great source of information when you want to look up previous workouts, sometime even from last year.

2.2 Overview Part 2
Scrolling down we will see 3 more rows with numbers about our actual input and output during a workout. Average and max heart rate, power and speed.
2.3 Colors
After uploading your workouts TrainingPeaks will show them to us in 4 different colors. What they exactly mean?
– green is for a workout which was done in 80-120% of plan
– yellow is for a workout which was done in 50-80% or 120-150% of plan
– orange is for a workout which was done in less than 50% or greater than 150% of plan
– red is for a workout which was not done at all


2.4 Map and Graph
Map with the route you did during the workout and all graphs together: elevation, heart rate, power, speed.

2.5 Heart Rate by Zone
The time you spend in your specific heart rate zones and heart rate peaks during time ranges.

2.6 Power by Zone
The time you spend in your specific power zones and power peaks during time ranges.

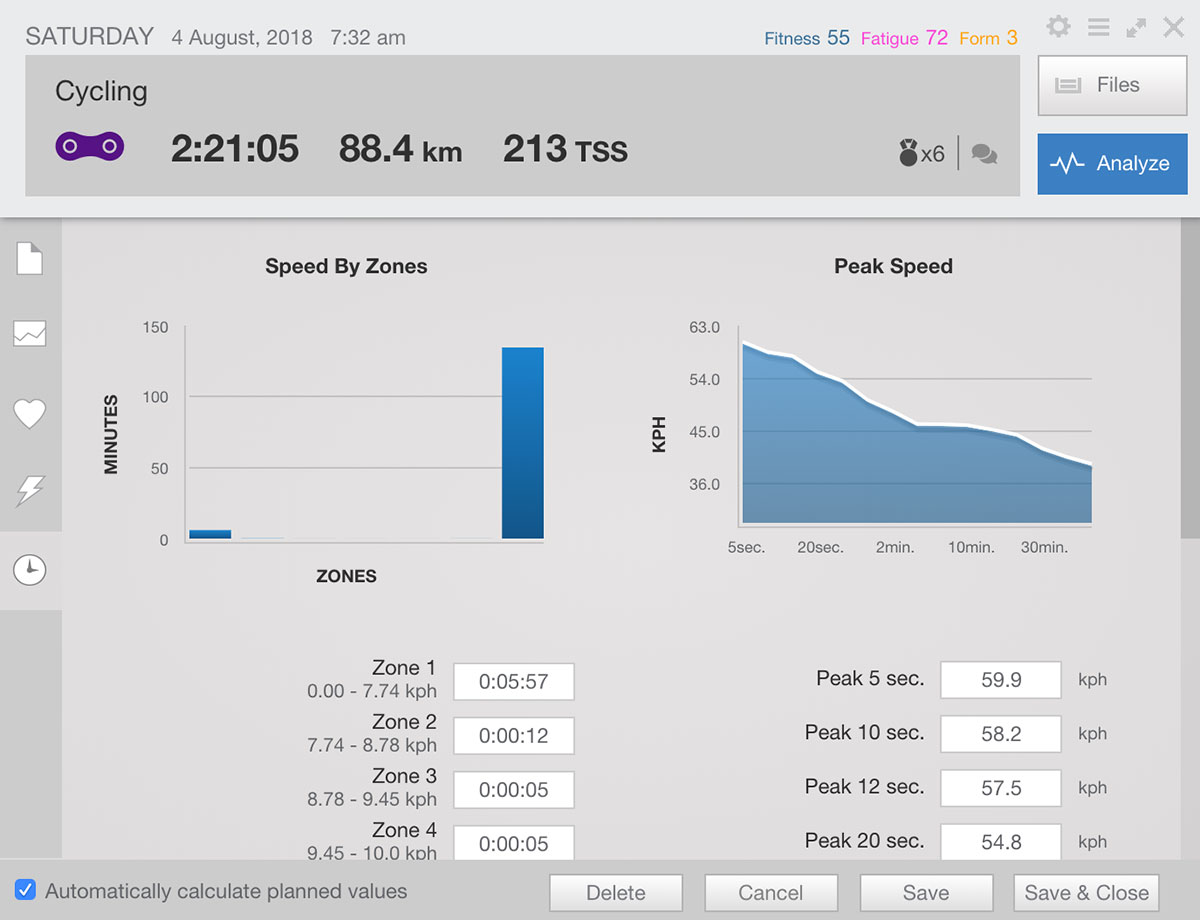
2.7 Speed by Zone
The time you spend in your specific speed zones and speed peaks during time ranges. Good information for people without a power meter, doing repeat uphills.
3. Analyze Window
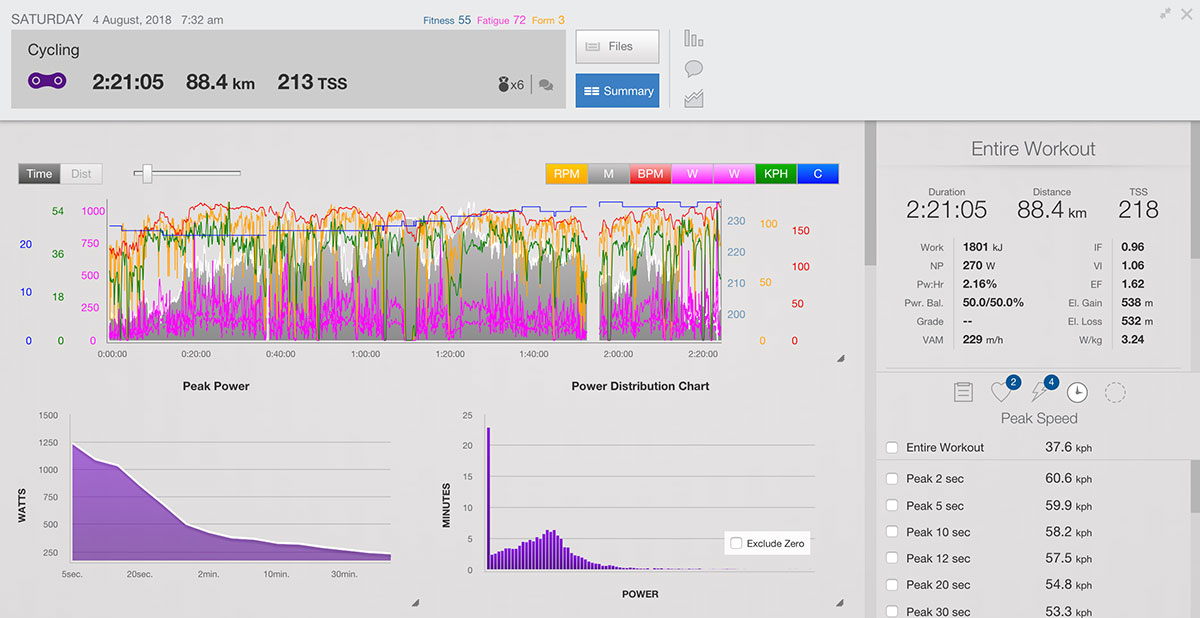
3.1 Overview
Analyze window will show up after clicking on “Analyze” button in the top-right corner of the summary window.
Top row stays the same.
Going down we have two parts wider one with all types of charts and a narrower one on the right side hand with all number.
Let’s take a look closer in the next steps
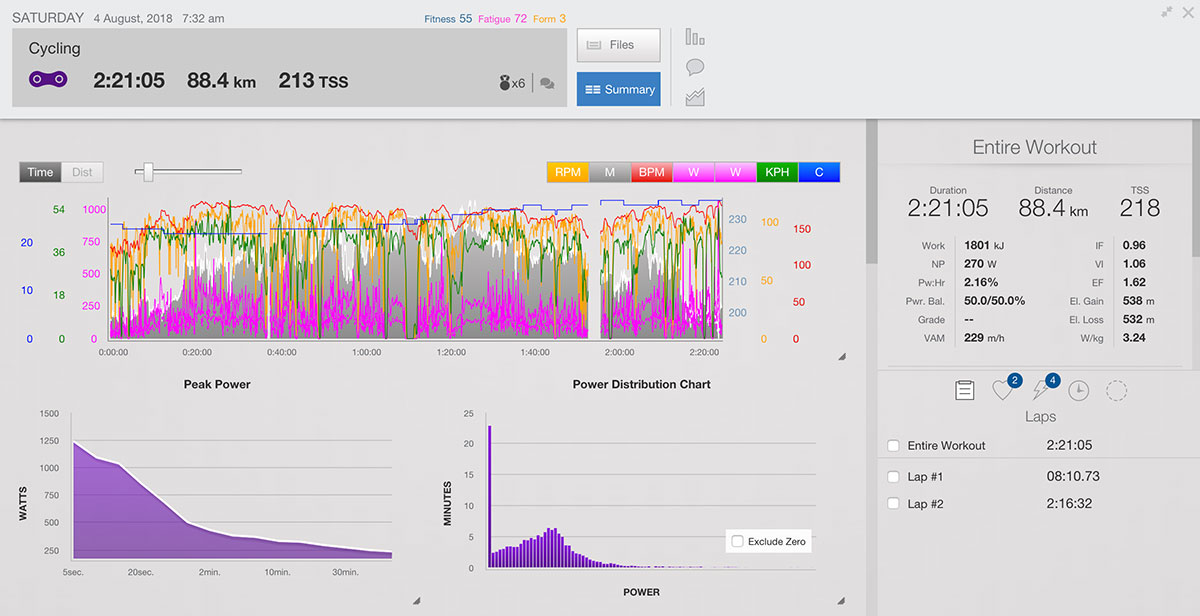
3.2 Hide and Show Charts
The first chart looks really busy and we can’t really see anything from it, to make it easier for us TrainingPeaks put filters in specific colors which allows us to hide it, hide others, show zones, delete and show if it is actually hidden.
We can do it for all kind of “lines”, power, heart rate, elevation, speed, cadence, temperature.

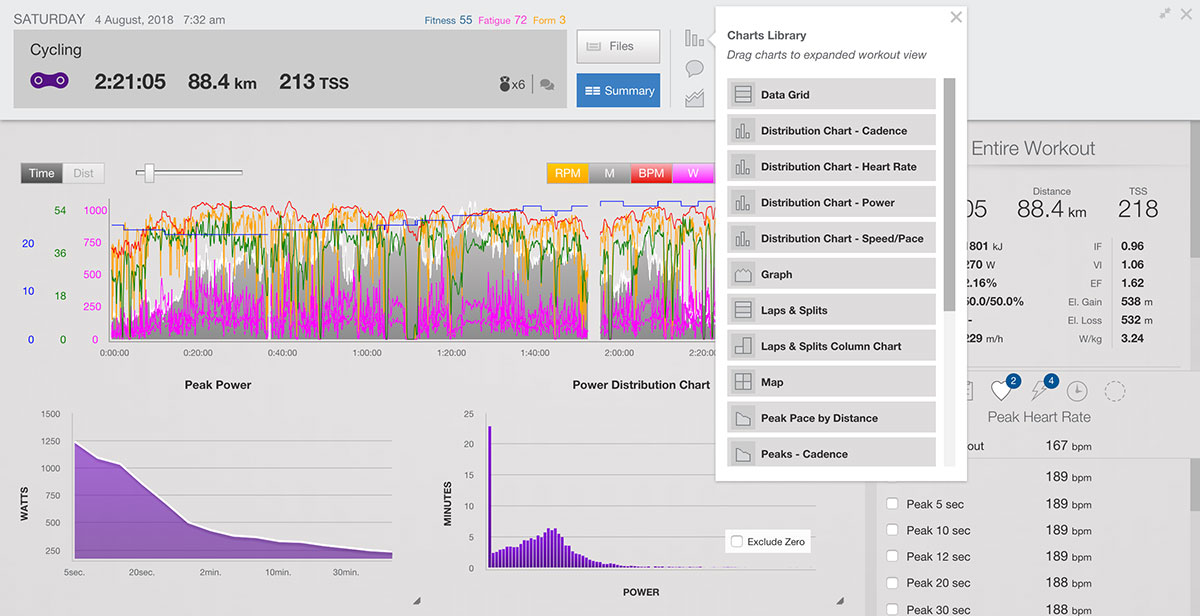
3.3 Charts Library
Here is where we can add more “charts” very useful if you looking for more data and want to dig into your workout. Training Peaks is a great tool for athletes and coaches.
3.4 Comments
It’s the same area which you could find in a summary window on the right-hand side. Description of your workout, pre-workout comments (tips) post-workout comments.

3.5 Elevation Correction
If you have a need you can fix your elevation part of the file.

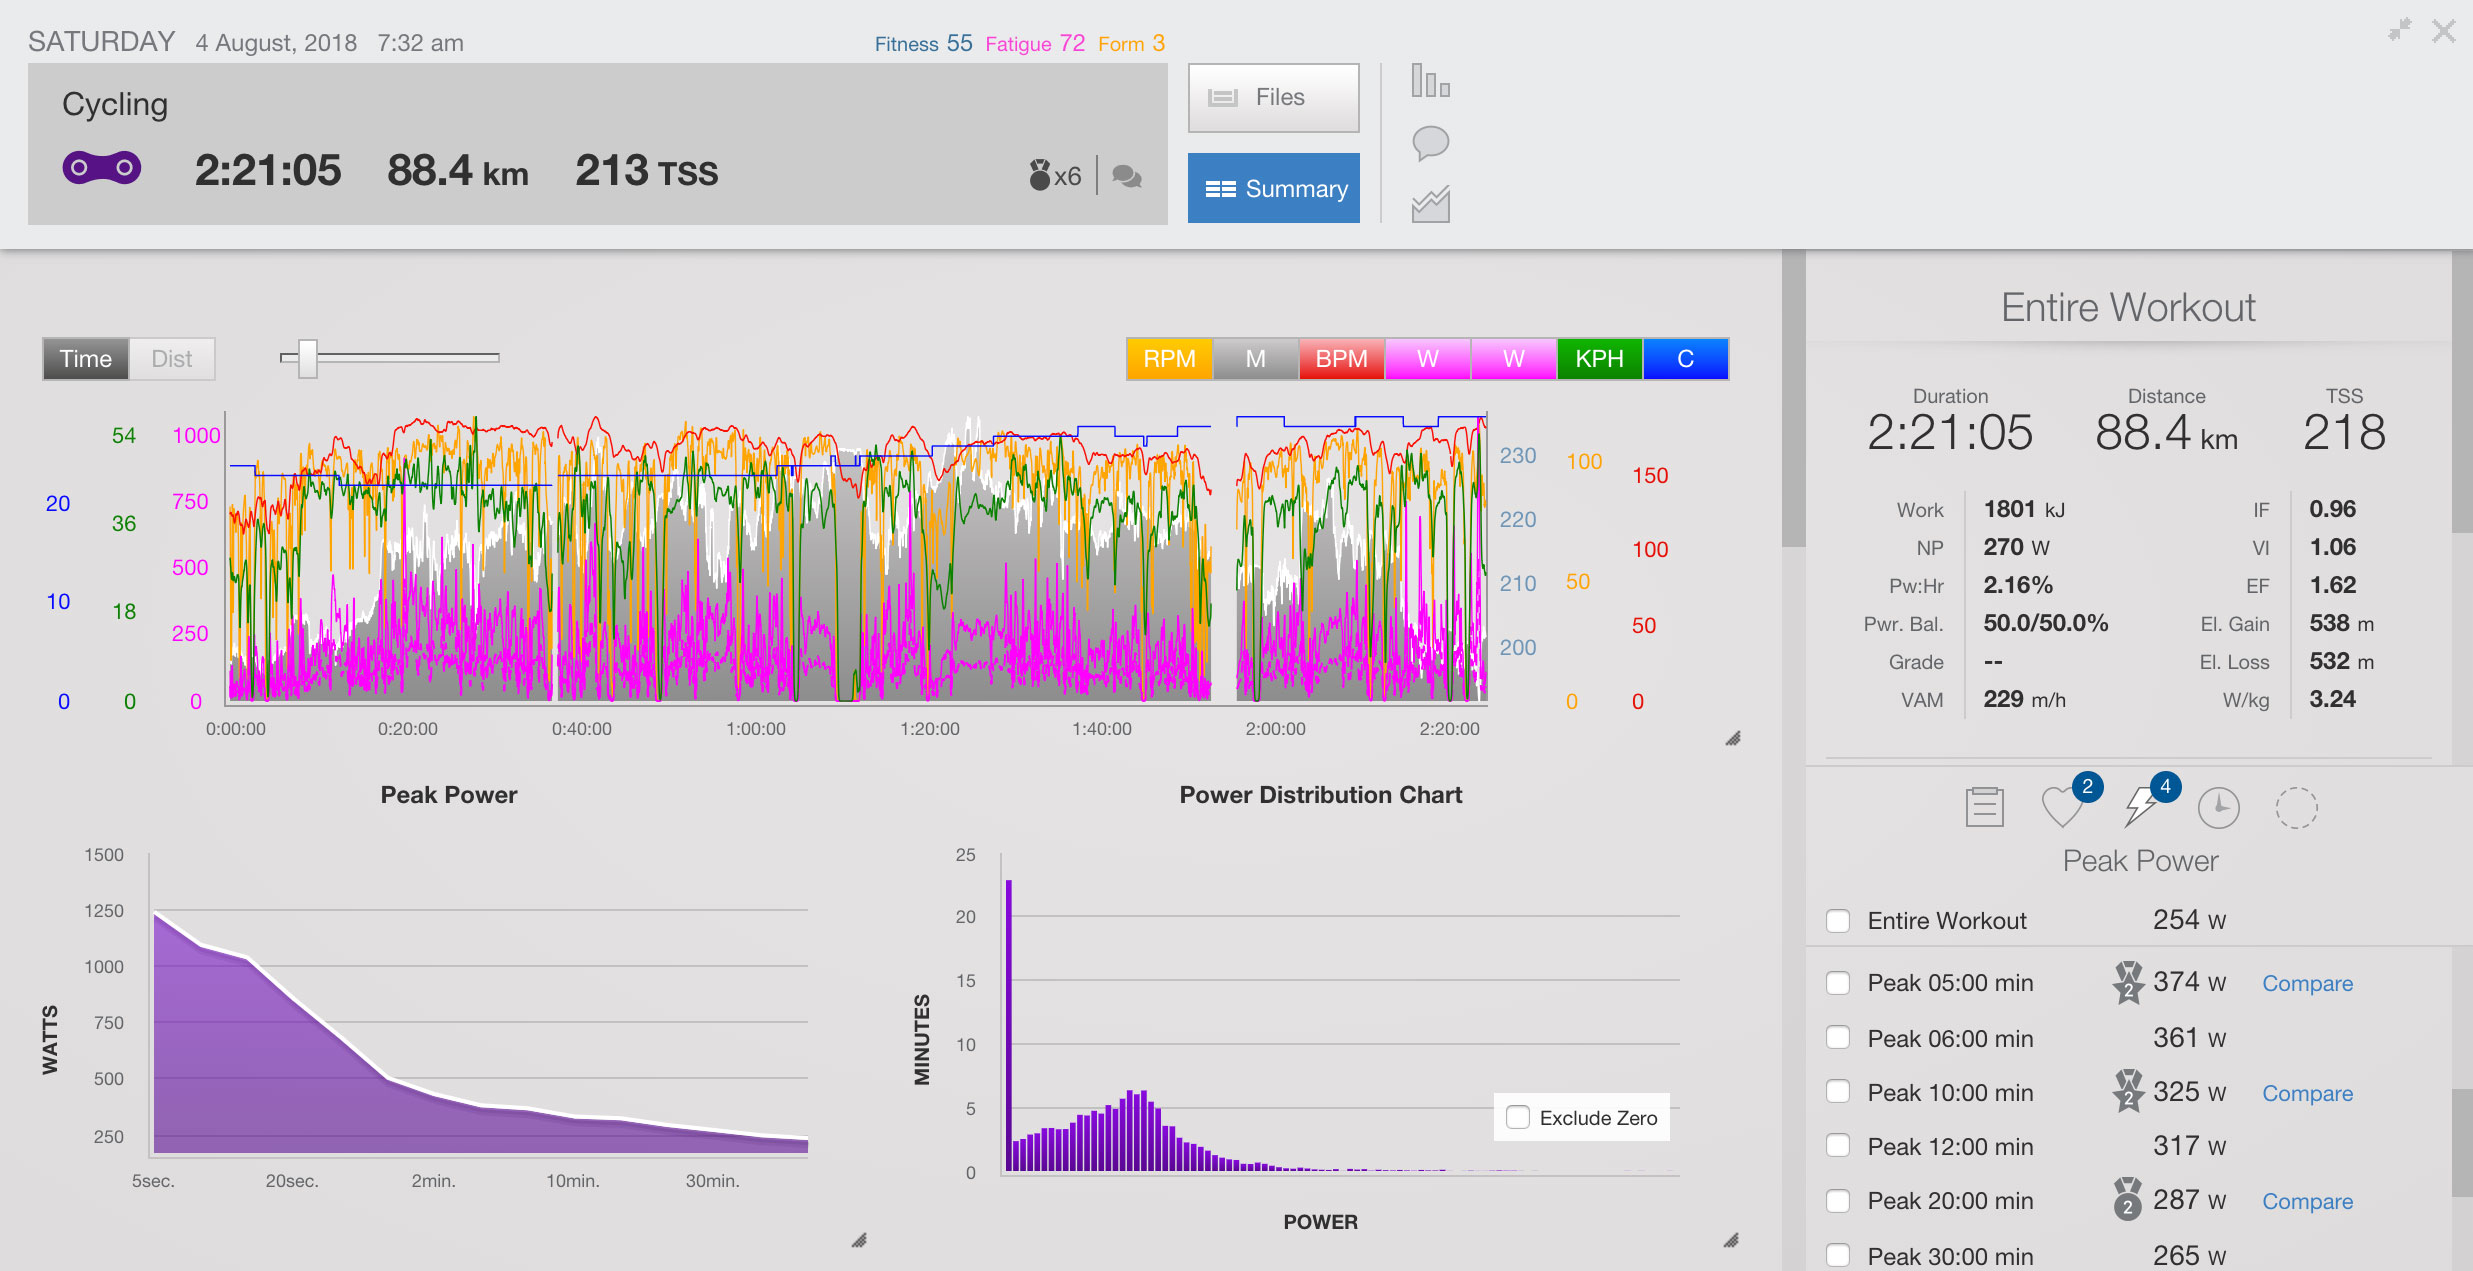
3.6 Peak Heart Rate
Going down to right-hand column to the bottom part we can see a few icons second of them looks like a heart. This is where you can find peak values for your heart rate.

3.7 Peak Power
Going to the next icon looking like thunder you can find your peak values of power.

3.8 Peak Speed
then we have speed peak values
3.9 Peak Cadence
and cadence.

4. Workout analyze
Now you have a better understanding of what are you looking at.
Now we can move to right-hand top “box” where we have another set of numbers and of them have some prefixes. What exactly they mean?
Let’s start with the first column:
– Work in kilojoules
– NP (Normalized Power)
– Pw:Hr – the balance between power and heart rate from the first and second half of workout
– Pwr. Bal
– Grade
– VAM
Second column:
– IF (Intensity Factor)
– VI (Variability Index)
– EF (Efficiency Factor)
– El. Gain
– El. Loss
– W/kg
4.1 Normalized Power (NP)
Normalized Power is weighted average power from your workout.
1-hour perfectly steady workout at power 200W give as Normalized Power = 200W
1-hour workout with 30 min at power 100W and 30 min at 300W give as Normalized Power = 250W
4.2 Pw:Hr
It can be used as a “rate of fatigue”. It could be used during long aerobic workouts, long climbs or time trials. Aerobic Decoupling reflects how heart rate is reacting to our input which is power.
4.3 VAM
Velocity Ascended in Meters/hr. VAM is telling us about our climbing skills. How many “verticals meter” we can climb per hour. Best cyclists in the world are getting to around 1650 Vm/h (Vertical meters per hour)
4.4 Intensity Factor (IF)
Intensity Factor is telling you about, how intense was your workout. Comparing your weighted average power and actual form gave you a perfect number to analyze. You can find out that IF will be between <0.50 to 1.15 or even more on short efforts.
4.5 Variability index (VI)
Variability index is normalized power divided by average power. VI is telling us about how steady was our workout.
4.6 Efficiency Factor (EF)
Efficiency Factor (EF) is Normalized Power (NP) (Input) from your workout divided by Average Heart Rate (Output) from your workout. The Efficiency Factor should be used for tracking your aerobic level.


Thank you for your information about fitness. This is very important for me and I’m very interested in your information.
You are welcome!